News

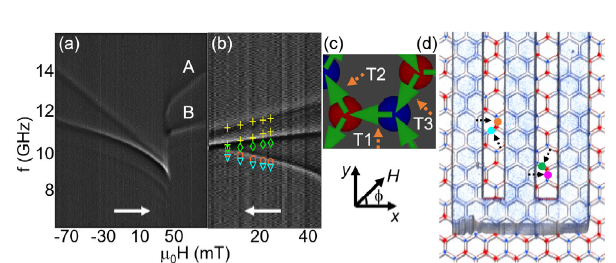
Gray scale FMR spectra map of sample A for a field protocol of (a) −90 → þ90 mT and (b) −90 → þ45 → 0 mT at ϕ ¼ 0°. To enhance the contrast, we show the difference between neighboring spectra (derivative). White arrows represent sweep direction of H. (c) Definition of T1, T2, and T3 nanobars with respect to the magnetic field direction. (d) Magnetic force microscopy image of sample A after a field protocol of −91.2 → þ44.1 → 0 mT along ϕ ¼ 0° (the x axis points upwards). Stray fields detected by MFM are colored in blue (red) consistent with two-in-one-out (one-in-two-out) configuration. The additional colored dots and arrows highlight positions explored by micro-BLS in Fig. 2. The integrated CPW is apparent.
In this paper, co-authored by Vinayak Bhat, group leader at MagTop, the authors investigate spin dynamics of microstates in artificial spin ice (ASI) in Ni81Fe19 nanomagnets arranged in an interconnected kagome lattice using microfocus Brillouin light scattering, broadband ferromagnetic resonance, magnetic force microscopy, x-ray photoemission electron microscopy, and simulations.
Phys. Rev. Lett. 125, 117208 (2020), arXiv:1910.00874 (2019)